In today’s post, I step through how I developed a statistics dashboard for an online maths game Arithmetic Zetamac. Zetamac is a minimalist online speed maths game which, although serves its purpose very well, does not have a native statistics dashboard or way to store your previous scores. As someone interested in tracking progress over time, I would track my scores on a google doc- a very labour intensive task. Today we will see how to automate local data storage using Selenium and produce a dashboard showing statistics using PySimpleGui.
The Zetamac Class
Let us commence our development process by defining a class named Zetamac which will encapsulate all of our program’s logic. We need to make sure that we parse the url of the game-type we want, and the length of that game into the constructer when initialising the class.
It is also important to check if the necessary infrastructure exists before diving into our code. Let’s make sure we check that our data storage csv exists in the program directory. Let’s also define our web driver- I used Chrome for no good reason.
class Zetamac:  def __init__(self, link: str, game_time: int)-> None:    self.link = link    self.game_time = game_time
    if not os.path.isfile('.\data.csv'):            with open('.\data.csv', 'w') as f:                writer = csv.writer(f)                header = ['time','score']                writer.writerow(header)                f.close()
    # define our driver for Selenium web interaction    self.driver = webdriver.Chrome('.\chromedriver')
Now that we have the base of our class established, let’s start building in some of the features. For the purposes of this blog post, I am going to omit some of the less interesting methods like init_browser() and init_game(), but rather discuss which methods they point to. The complete code will be listed at the bottom of this post for those that are interested.
Data Scraping and End of Game GUI
The init_game() method is called at the beginning of every game. This method simply executes time.sleep() for the duration of the game, and then calls the store_data() method followed by self.end_of_game(). Let’s take a look these methods.
def store_data(self) -> int:        """        Attempt to store data        """        try:            score = self.driver.find_element_by_xpath('//*[@id="game"]/div/div[2]/p[1]').text.split()[-1]
        except IndexError:            print('Score not in! Trying again in 2 seconds.')            time.sleep(3)            score = self.driver.find_element_by_xpath('//*[@id="game"]/div/div[2]/p[1]').text.split()[-1]
        with open('.\data.csv', 'a', newline = '') as f:            writer = csv.writer(f)            data = [datetime.now(), score]            writer.writerow(data)            f.close()
        return score
I am confident there is a more elegant way to deal with waiting the duration of the game, by checking for final establishment of the score for example, but I opted for a very quick and dirty method- terrible programming practice. This method uses Selenium to scrape the score from the website via its xpath. It is typical that, depending on site loading times, the script is executed early and an IndexError is thrown. This is handled with an exception allowing more time. After we get the score, it is timestamped and stored in the local csv.
Let’s take a look at how the end_of_game popup is implemented in PySimpleGui:
def end_of_game(self, score: int) -> None:        """        GUI for end of game scenario        """        sg.theme('DarkAmber')        font = ('Roboto Mono', 10)
        layout = [                    [sg.Text(size=(1,1), key='-OUT-')],                    [sg.Text('Score: {}'.format(score), font = ('Roboto Mono', 16))],                    [sg.Text('Restarting in ...', key = '-TEXT-')],                    [sg.Text(size=(1,1), key='-OUT-')],                    [sg.Button('Play Again'), sg.Button('Stats'), sg.Button('Exit')]                ]
        window = sg.Window(            'Zetamac',            layout,            element_justification='c',            size=(400, 175),            font = font,            finalize=True        )
        timer = Countdown(5)        window.bring_to_front()
The physical appearance of the GUI is organised within the layout array in rows. We can define columns too, which we will see how to do a little later in the stats dashboard implementation.
A lot of button clicking between games can get a little tedious too so I implemented an auto-restart feature 5 seconds after a game is completed. Countdown is a separate class defined as follows:
class Countdown:    def __init__(self, seconds: int):        self.target_time = int(time.time()) + seconds        self.running = True
    def counting(self):        """        Returns seconds until timer is complete        """        time_remaining = max(self.target_time - int(time.time()), 0)        if not time_remaining:            self.running = False
        return time_remaining
    def status(self):        """        Check if countdown has reached expiry        """        return self.running
In our case, we are using a 5 second countdown which is called within our event loop:
# match indentation from end_of_game method        while True:            # event loop            event, values = window.read(timeout = 10)
            if event in (sg.WIN_CLOSED ,'Exit'):                self.driver.quit()                window.close()                break
            elif event == 'Play Again' or not timer.status():                window.close()                self.restart_game()                break
            elif event == 'Stats':                window.close()                self.stats(score)                break
            window['-TEXT-'].update('Restarting in ... {}'.format(timer.counting()))
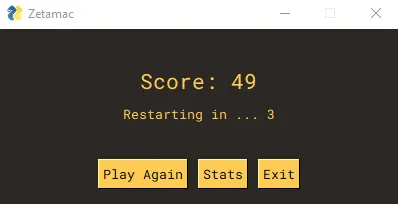
The window.update() call is what allows us to change the countdown on the screen for the user to see. This is what the end of game GUI with the specified theme looks like!

Statistics Dashboard
The main event of the program is the statistics dashboard. The calculation of these statistics is relatively boring, so we will instead focus on the implementation of the GUI. It is worth noting that the stats_calculation method outputs a tuple containing all of the statistics calculated from the data csv.
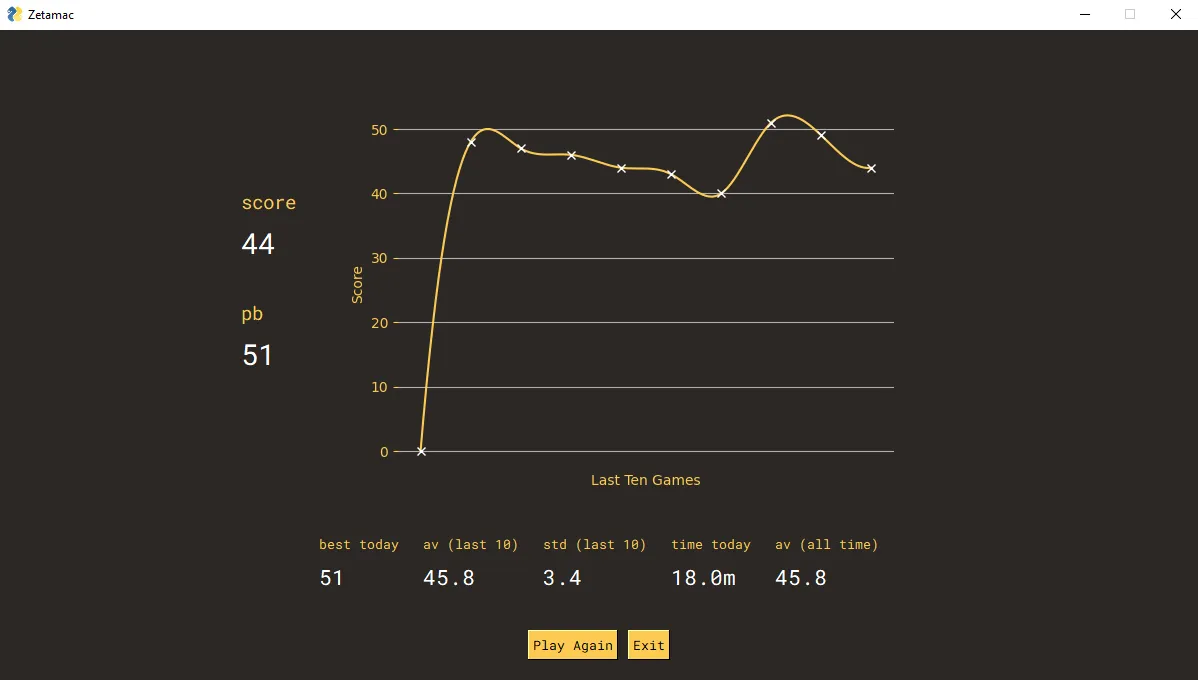
One of the stand-out features of the dashboard is the plot. This is made in matplotlib with scores from the user’s previous ten games. The line is smoothed using scipy’s interpolate.make_interp_spline. Disclaimer: I am aware that this sometimes results in scores that are negative or inflated in an effort to fit a nice curve. This is a purely aesthetic choice and there is nothing mathematical about it! :)
The stats dashboard is implemented as follows:
def stats(self, score: int) -> None:        """        GUI for performance statistics dashboard        """        statistics = self.stats_calculation()        self.generate_stat_plot()
        sg.theme('DarkAmber')        font = ('Roboto Mono', 10)
        image = [[sg.Image('./plot.png')]]        col = [            [sg.Text('score',font = ('Roboto Mono', 14))],            [sg.Text(score, font = ('Roboto Mono', 22), text_color= 'white')],            [sg.Text(size=(1,1), key='-OUT-')],            [sg.Text('pb',font = ('Roboto Mono', 14))],            [sg.Text(statistics[0],font = ('Roboto Mono', 22), text_color= 'white')]        ]
        def mini_col(label, score):            return sg.Column([[sg.Text(label, font = ('Roboto Mono', 10))],[sg.Text(score, font = ('Roboto Mono', 16), text_color= 'white')]])
        layout = [                    [sg.Column(col),                    sg.Column(image, element_justification='c')],                    [                        mini_col('best today', statistics[1]),                        mini_col('av (last 10)',statistics[2]),                        mini_col('std (last 10)',statistics[3]),                        mini_col('time today',statistics[4]),                        mini_col('av (all time)',statistics[5])                        ],                    [sg.Text(size = (1,1), key = '-OUT-')],                    [sg.Button('Play Again'), sg.Button('Exit')]                ]
        window = sg.Window(            'Zetamac',            layout,            element_justification='c',            size=(1200, 650),            font = font        )        event, values = window.read()
        if event == sg.WIN_CLOSED or event == 'Exit':            window.close()            self.driver.quit()
        if event == 'Play Again':            window.close()            self.restart_game()
You can also see my incredibly messy column implementation here (please reach out if you have any suggestions for tidying up the code!). I have also implemented two buttons at the bottom which allow the user to exit or restart the game. The dashboard ended up looking like this:

Here you can notice the wiggly effect of the fitted line.
Concluding Thoughts and Full Code
Overall, in terms of maintainability, the code base is pretty poor. There are a lot of static parts that can break the code if the website is ever updated, and more generally a lot of places where things can go wrong. However, for my use case I think that is fine- this was a quick and dirty script to solve a simple problem after all.
If you are interested in checking out the full code, I have a public repo linked here. I would love your feedback and ideas for improvements too. Contact details in the side bar!