Introduction
During my undergraduate studies, the Nonlinear Dynamics and Chaos course stood out not for its mathematical complexity, but for its aesthetic charm. There’s something captivating about studying chaotic attractors— sets of states toward which a system evolves— and then using Python to numerically solve their governing differential equations, creating unique visualizations.
For instance, consider the Lorenz system, defined by:
When visualized, this system produces the iconic butterfly-shaped attractor that has become synonymous with chaos theory.
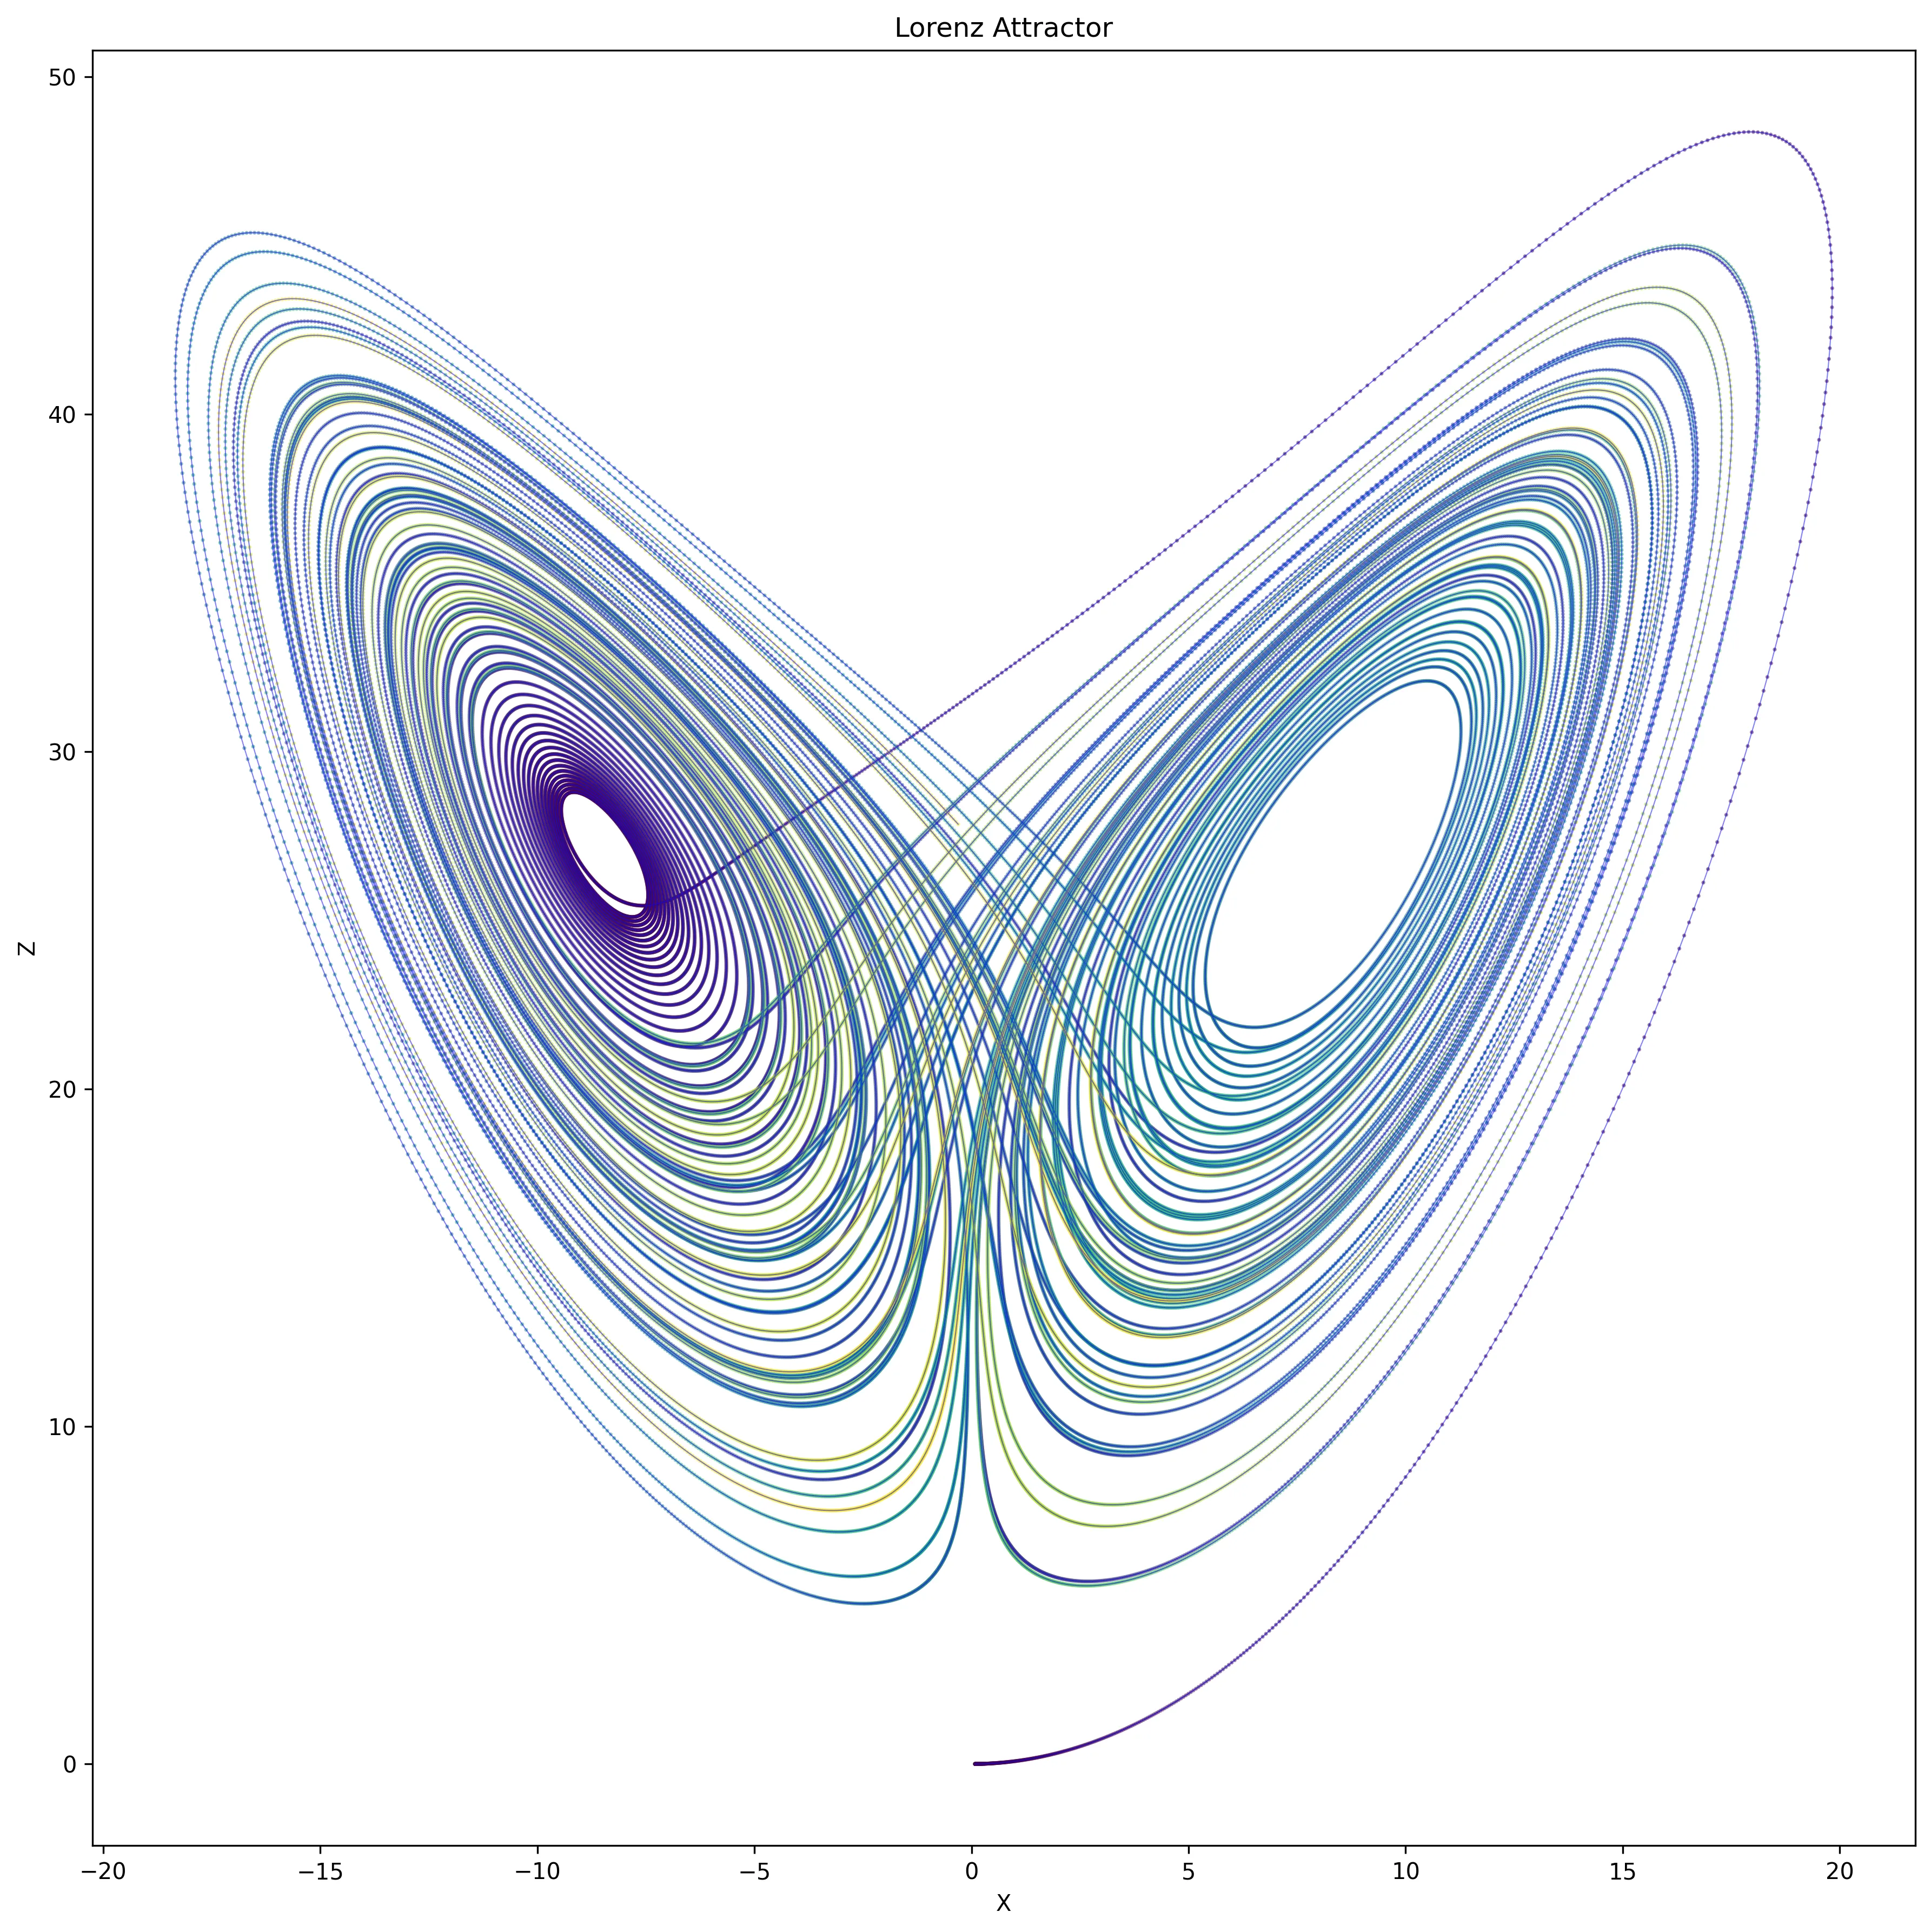
While studying these systems is fascinating, developing new chaotic differential equations that produce intriguing trajectories is challenging. This challenge motivated my current project: using deep learning to generate novel trajectories that maintain the characteristic features and visual interest of known chaotic systems.
The idea is to train a generative model on a dataset of existing chaotic system trajectories. By doing so, we aim to create an AI that can produce new, mathematically consistent trajectories that exhibit chaotic behavior.
Creating the Dataset
For our dataset I’m going to use 7 distinct 3-d chaotic systems: Lorenz, Rössler, Chen, Chua, Thomas, Sprott, and Dadras. Each system is defined by a set of nonlinear differential equations that produce complex, unpredictable behaviors despite their deterministic nature.
| System Name | Differential Equations |
|---|---|
| Lorenz | |
| Rössler | |
| Chen | |
| Chua | |
| Thomas | |
| Sprott | |
| Dadras |
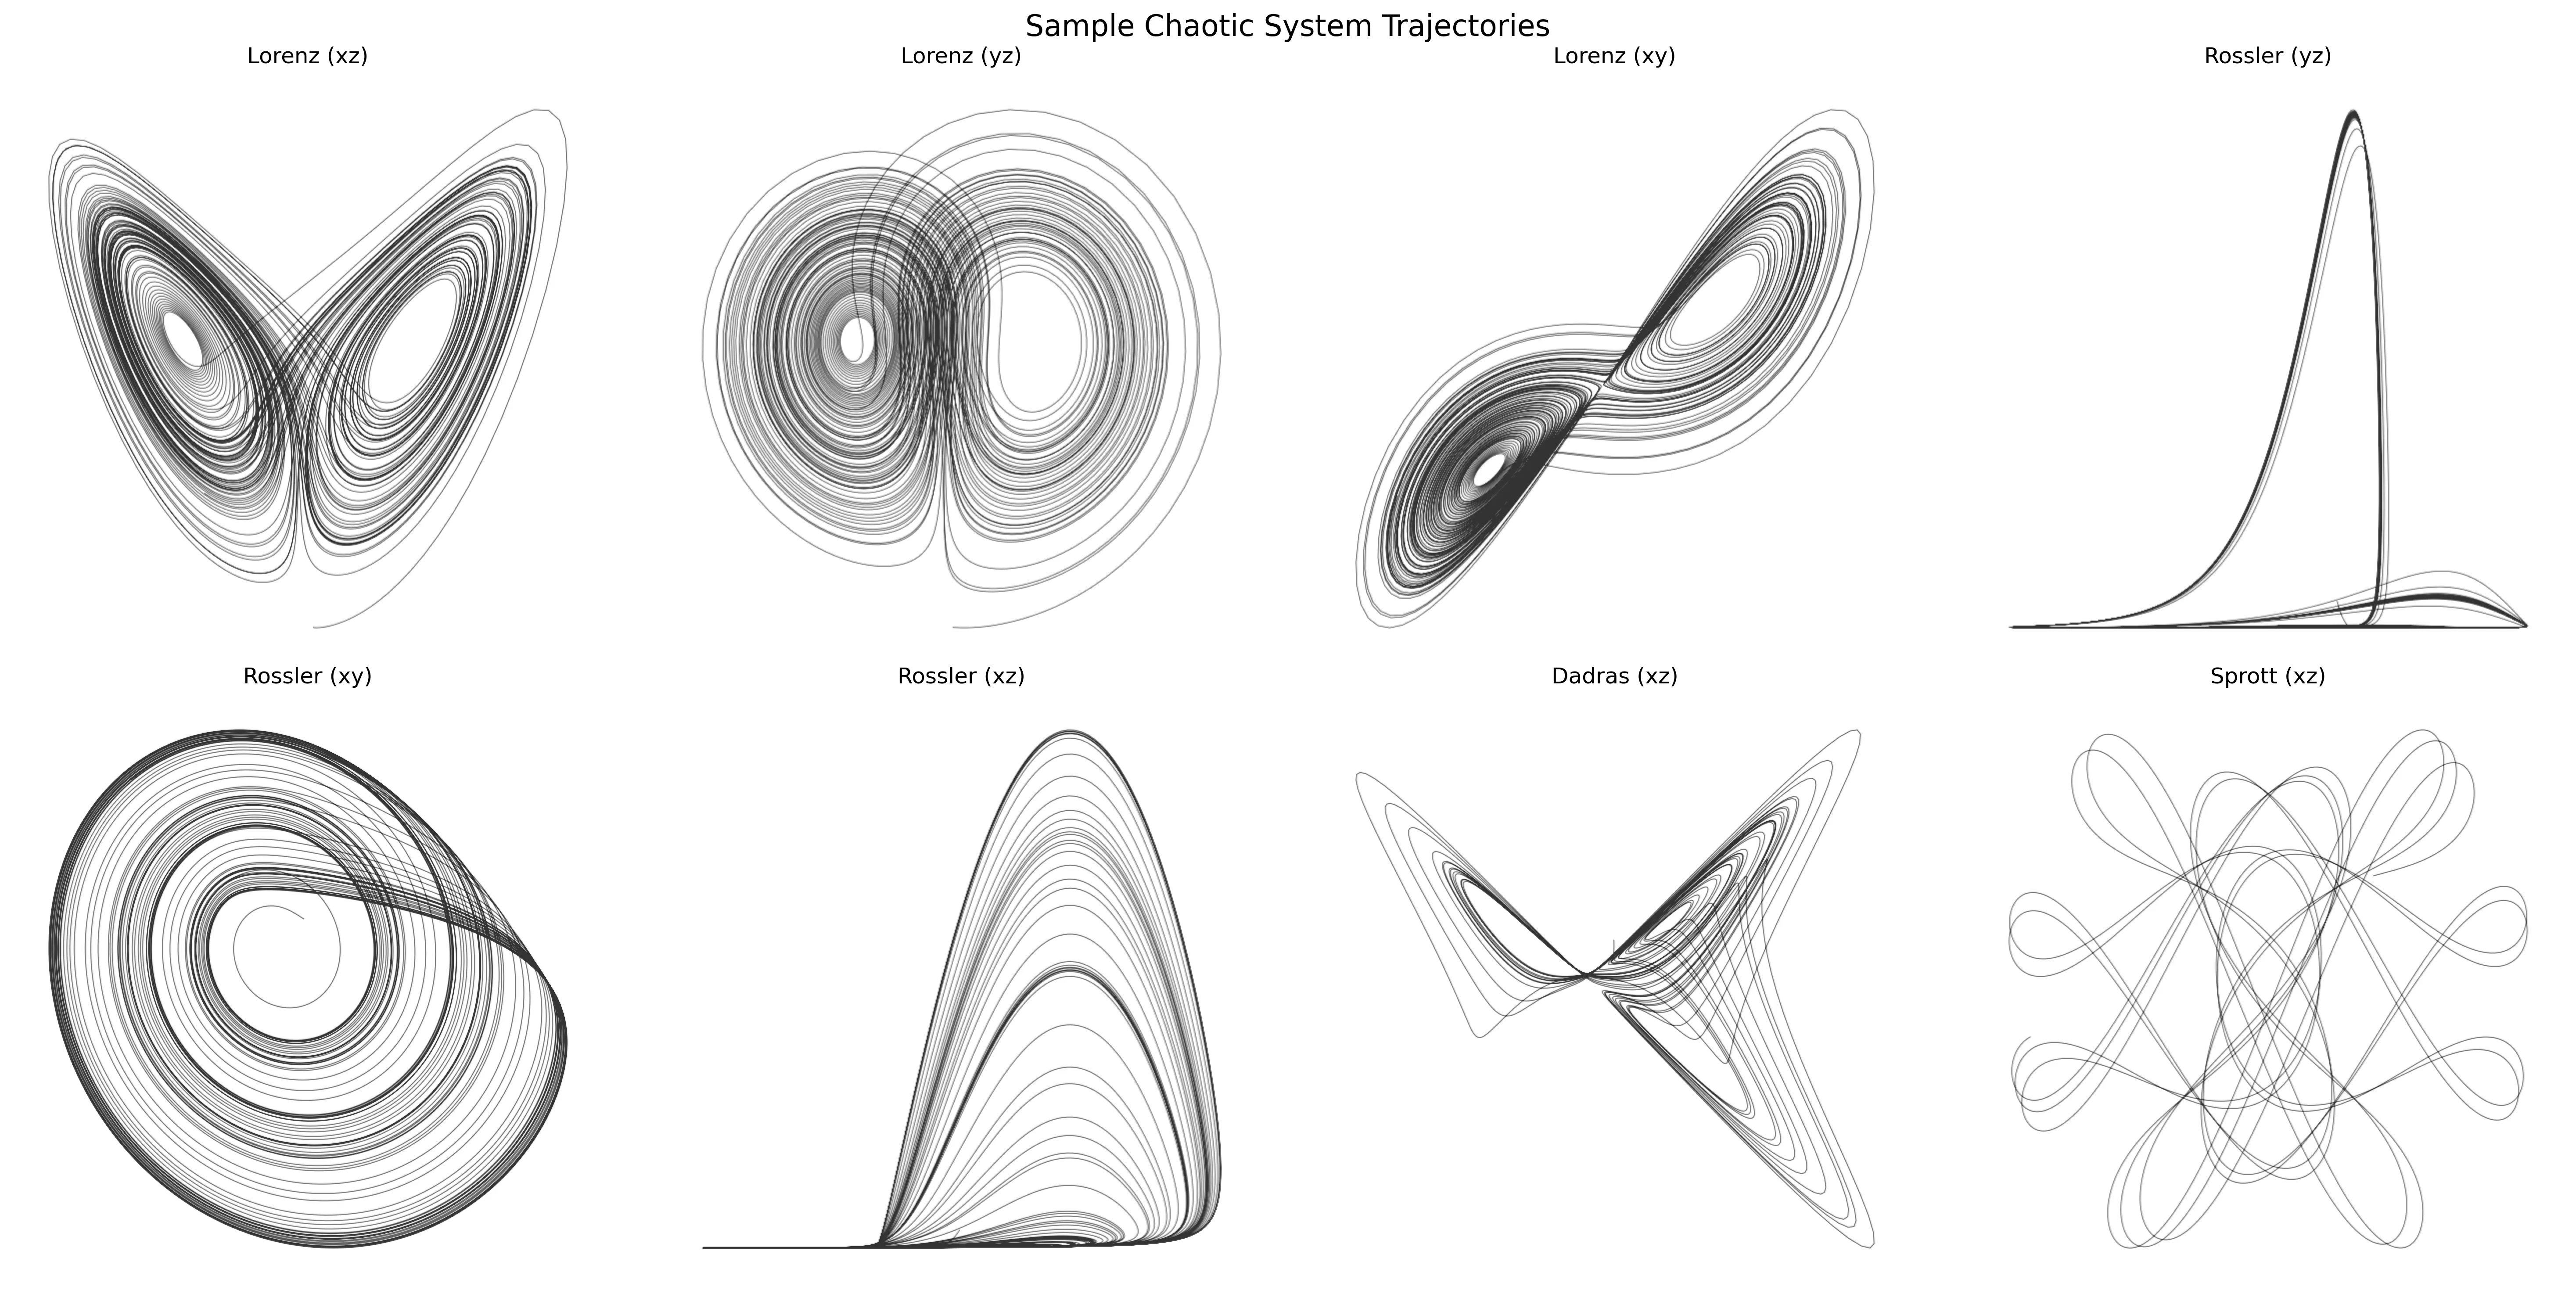
To enrich our dataset and provide a comprehensive view of these systems, we generate images from different perspectives. For each system, we create visualizations using three projections: xy, xz, and yz. This approach allows us to capture the intricate structures and behaviors of these attractors from multiple angles. Additionally, we introduce slight perturbations to the initial conditions and parameters for each generation, ensuring a diverse set of trajectories while maintaining the characteristic features of each system. This method produces a rich, varied dataset that showcases the beauty and complexity of chaotic dynamics from various viewpoints.
Let’s visualise the dataset:
Training the GANs
To tackle the challenge of creating new chaotic trajectories, I turned to Generative Adversarial Networks (GANs). GANs are a class of machine learning frameworks where two neural networks contest with each other in a game-theoretic scenario. The generator network creates candidates (in our case, images of chaotic trajectories), while the discriminator network evaluates them. The generator learns to produce increasingly realistic data, while the discriminator learns to get better at distinguishing real data from the generated ones.
In our implementation, the generator takes random noise as input and produces 64x64 grayscale images of chaotic trajectories. Here’s a simplified version of our generator architecture:
class Generator(nn.Module):    def __init__(self, latent_dim):        super(Generator, self).__init__()        self.model = nn.Sequential(            nn.ConvTranspose2d(latent_dim, 512, 4, 1, 0, bias=False),            nn.BatchNorm2d(512),            nn.ReLU(True),            # ... [additional layers]            nn.ConvTranspose2d(64, 1, 4, 2, 1, bias=False),            nn.Tanh()        )
    def forward(self, input):        return self.model(input)
The discriminator, on the other hand, takes these images (both real and generated) and tries to classify them as real or fake:
class Discriminator(nn.Module):    def __init__(self):        super(Discriminator, self).__init__()        self.model = nn.Sequential(            nn.Conv2d(1, 64, 4, 2, 1, bias=False),            nn.LeakyReLU(0.2, inplace=True),            # ... [additional layers]            nn.Conv2d(512, 1, 4, 1, 0, bias=False),            nn.Sigmoid()        )
    def forward(self, input):        return self.model(input).view(-1).float()
Training on the 10,000 Image Dataset
To train our GAN, we utilized the dataset of 10,000 chaotic system trajectory images we generated earlier. The training process involves alternating between training the discriminator and the generator. We run this process for 100 epochs, with a batch size of 64 images.
After each epoch, we save a sample of generated images to track the progress visually. This allows us to see how the quality of the generated trajectories improves over time.
One interesting aspect of this approach is that the GAN isn’t just learning to reproduce the exact images in our dataset. Instead, it’s learning the underlying patterns and characteristics that make these trajectories appear “chaotic”. If successful, our trained generator should be able to produce new, unique trajectories that share the visual characteristics of chaotic systems, potentially even blending features from different systems in novel ways.
Let’s examine some of the results from our GAN training and discuss what insights we can gain from this approach to generating chaotic trajectories.
Results
Let’s visualise the learned results over the epochs:
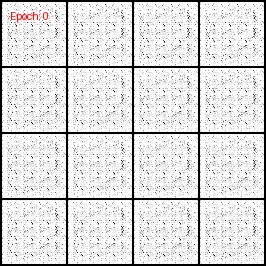
As we progress through the training epochs, we observe a clear convergence in our GAN’s output. However, a closer examination of the generated images reveals some areas for improvement.
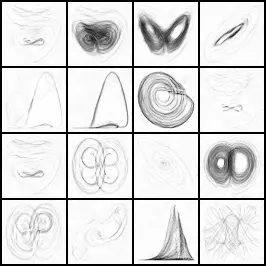
At epoch 86, we see that our GAN has successfully captured the key shapes and structures of the seven chaotic systems in our dataset. The generated images display the characteristic swirls, loops, and bifurcations that we associate with chaotic attractors. However, the GAN appears to be primarily reproducing variations of the input systems, rather than creating novel trajectories. This tendency towards reproduction rather than innovation suggests that our model might be overfitting to the specific examples in our training set, rather than extracting more general stylistic features of chaotic systems.
We may not be providing enough diversity for the GAN to learn the underlying principles of chaotic trajectories, rather than just memorizing specific examples. Let’s use the t-Distributed Stochastic Neighbor Embedding (t-SNE), a technique for visualizing high-dimensional data, to explore this idea. By applying t-SNE to our dataset, we can get a geometric representation of the variance within and between our chaotic system classes.
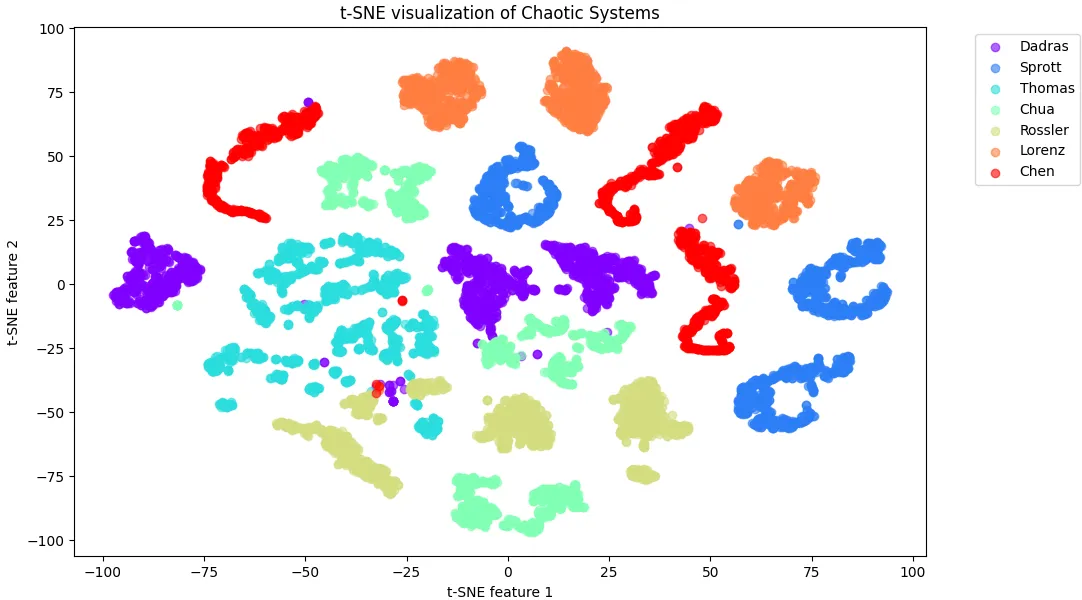
The t-SNE visualization provides several key insights:
- Distinct Clustering: Each of the seven chaotic systems forms distinct, well-separated clusters. This clear separation indicates that our dataset captures the unique characteristics of each system effectively.
- Intra-Class Structure: Within each system’s cluster, we observe three distinct sub-clusters. These likely correspond to the three different projections (xy, xz, yz) we generated for each system.
- Limited Overlap: There is minimal overlap between the different systems, with only a few points bridging the gaps between clusters.
This visualization helps explain our GAN’s behavior. The clear separation between systems makes it easy for the GAN to learn to reproduce each system distinctly. However, the lack of overlap and the discrete nature of the projections might be limiting the model’s ability to generalize and create truly novel trajectories. To address this, we need to reconsider our data generation approach. Rather than using fixed xy, xz, and yz projections, we could implement a more continuous range of viewing angles. This would create a smoother distribution of trajectories, potentially filling in the gaps between our current discrete clusters.